

In an era where data is no longer just a commodity but the very oxygen fueling modern innovation, the challenge has shifted from mere collection to sophisticated extraction of actionable intelligence. The traditional triumvirate of data science, analytics, and visualization, while foundational, is undergoing a profound transformation, evolving into a dynamic ecosystem of decision intelligence powered by agentic AI and real-time visual analytics. This article delves into the cutting edge of this evolution, exploring how these disciplines converge to unlock unprecedented insights and drive strategic advantage in 2026 and beyond.
The Trinity Reimagined: Data Science, Analytics, and Visualization in the Age of AI
To truly outrank the competition, it is imperative to understand not just what these fields are but how their symbiotic relationship is being redefined by emerging technologies.
Data Science: The Architect of Intelligence
Data Science, at its core, remains the multidisciplinary engine that uses scientific methods, algorithms, and systems to extract knowledge from both structured and unstructured data. However, in 2026, its role is increasingly characterized by the integration of advanced AI paradigms:
- Agentic AI and Autonomous Data Workflows: The rise of Agentic AI marks a significant shift. These autonomous AI agents are moving beyond being mere tools to becoming active participants in the data lifecycle, capable of generating data, converting business logic into SQL queries, and even creating ingestion scripts for diverse data sources. This means data scientists are increasingly becoming orchestrators of intelligent systems rather than solely manual practitioners.
- Data-Centric AI and Synthetic Data: The focus is shifting from model-centric AI to data-centric AI, where the quality and structure of data are paramount. Synthetic data generation, driven by advanced AI, is becoming crucial for training robust models, especially in scenarios where real-world data is scarce, sensitive, or biased.
Analytics: The Engine of Meaning
If data science builds the intelligent systems, analytics is the driver that processes and performs statistical analysis on datasets to turn “what happened” into “why it happened” and, crucially, “what should we do about it.” The traditional four categories of analytics descriptive, diagnostic, predictive, and prescriptive are now supercharged by AI:
•Autonomous Analytics: AI is enabling analytics to become more autonomous, with systems capable of identifying patterns, anomalies, and insights with minimal human intervention. This accelerates the diagnostic and predictive phases, allowing organizations to react with unprecedented speed .
•Decision Intelligence (DI): This emerging discipline is the evolution of analytics, combining data, AI, and human judgment to improve decision-making at scale. DI provides a structured approach to decision-making, moving beyond traditional business intelligence to offer a more holistic and impactful framework . Organizations adopting DI are reporting significant improvements in decision-making effectiveness.
Visualization: The Language of Action
Even the most sophisticated insights are useless if they cannot be effectively communicated. Data Visualization acts as the critical bridge to human understanding, transforming complex data into intuitive and actionable narratives. In 2026, visualization is becoming more dynamic and intelligent:
- Real-time Visual Analytics: The demand for real-time insights has made real-time visual analytics a competitive necessity. Static dashboards are giving way to dynamic, interactive visualizations that update continuously, providing immediate feedback on evolving data landscapes .
- Generative AI for Visualization: Generative AI is beginning to automate the creation of visualizations, allowing users to describe their data and desired insights in natural language, and the AI generates appropriate charts and dashboards. This democratizes access to powerful visualization tools and accelerates the insight generation process.
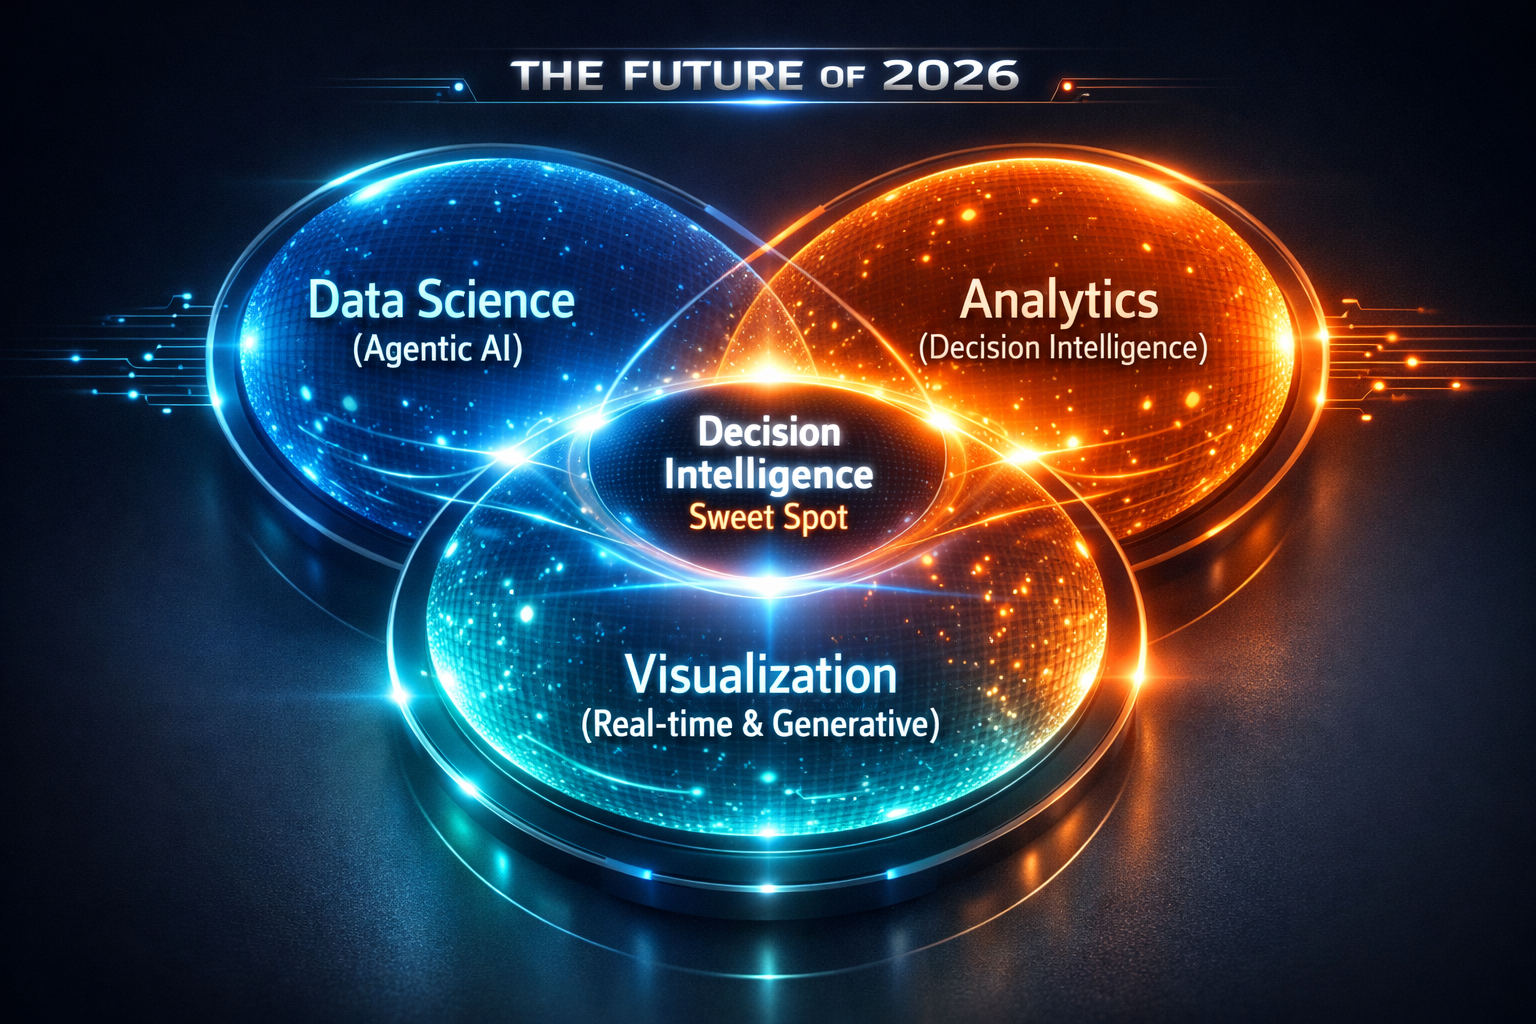
The Intersection: Where Decision Intelligence Lives
The true power lies not in these pillars in isolation, but in their seamless integration. This intersection is where Decision Intelligence truly flourishes, creating an “Agent-Ready” environment where data flows intelligently from discovery to action. Data scientists design the AI agents, analytics professionals define the decision frameworks, and visualization experts craft the interfaces that allow humans to interact with and validate these autonomous systems.
Case Study: The Autonomous Supply Chain
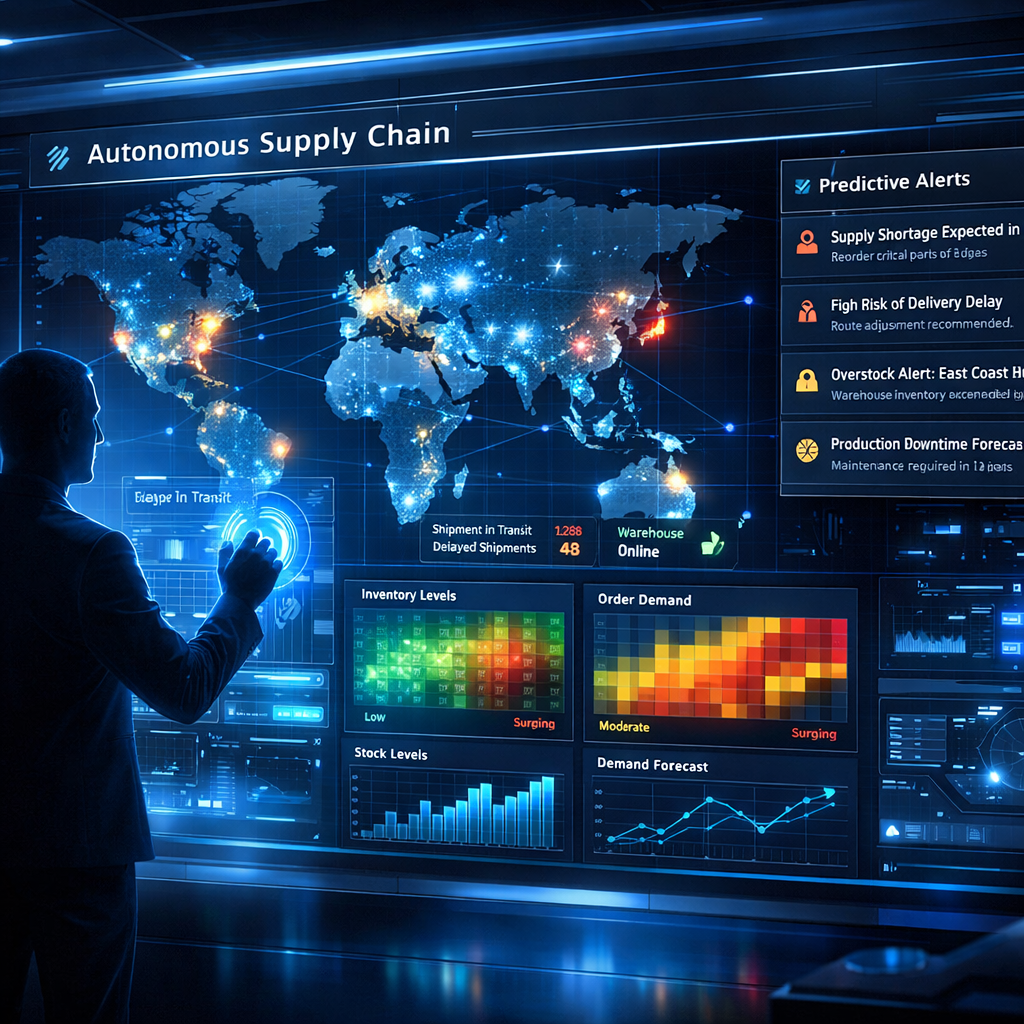
Consider a global retail giant leveraging this integrated approach. Data Science, powered by Agentic AI, constantly monitors global economic indicators, weather patterns, and social media sentiment to predict potential supply chain disruptions. Analytics, driven by autonomous systems, then identifies specific product lines and regions that will be most affected, prescribing optimal inventory reallocation strategies. Finally, Real-time Visual Analytics presents these complex scenarios on interactive dashboards, allowing human decision-makers to quickly understand the situation, validate AI recommendations, and execute changes with confidence. This seamless flow of information and intelligence ensures resilience and efficiency in an increasingly volatile global market.
Future-Proofing Your Career: The Skills Gap
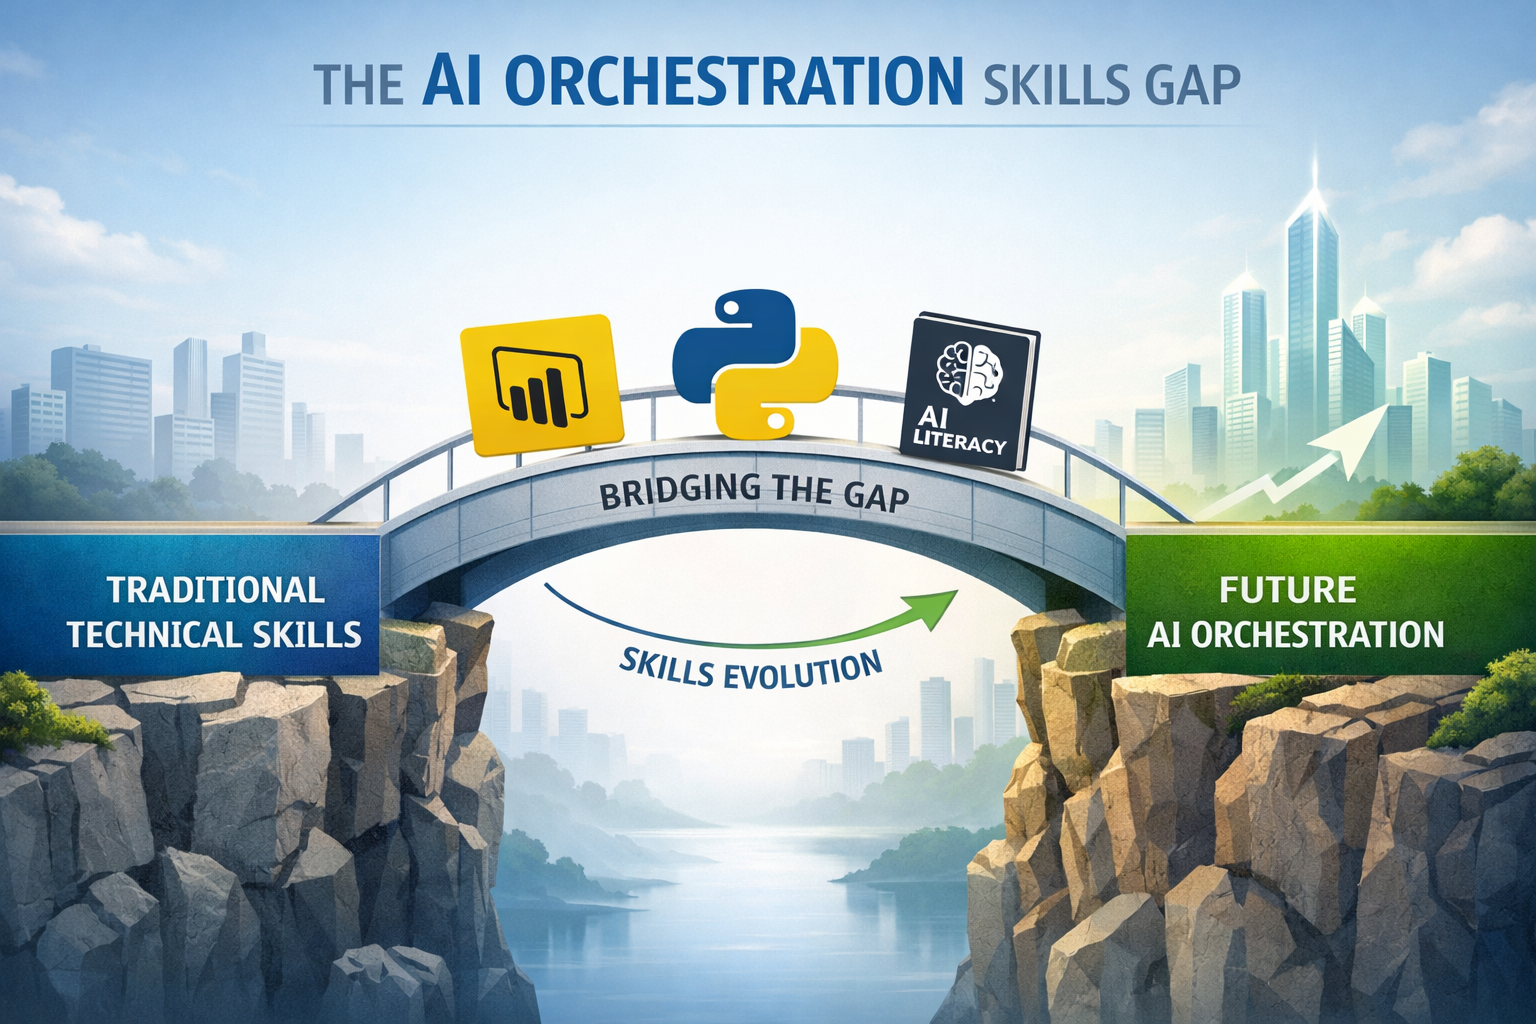
The rapid evolution of this landscape creates a new demand for professionals who can not only understand these individual disciplines but also orchestrate their synergy. Technical literacy is no longer sufficient; the ability to design, manage, and interpret AI-driven data workflows, what we term “AI Orchestration” skills—is paramount. For those looking to bridge this skills gap and thrive in the data-driven future, specialized training is essential. ForElite Training Institute offers a range of courses designed to equip professionals with these critical skills, including:
Conclusion: Listening to the Signal in the Noise
The journey from raw data to actionable insight is more complex and more rewarding than ever before. By embracing the evolving synergy of Data Science, Analytics, and Visualization, augmented by the power of Agentic AI and Decision Intelligence, professionals and organizations can move beyond merely collecting data to truly listening to what it has to tell them. The future belongs to those who can master this art of insight, transforming noise into knowledge and knowledge into unparalleled strategic advantage.
Frequently Asked Questions (FAQs )
What is the primary difference between Data Science, Data Analytics, and Data Visualization?
While often used interchangeably, these three disciplines represent distinct yet interconnected stages in the data-to-insight journey. Data Analytics primarily focuses on examining historical data to answer “what happened” and “why it happened,” often involving statistical analysis and reporting. Data Science is a broader, multidisciplinary field that uses advanced algorithms, machine learning, and predictive modeling to forecast “what will happen” and “how can we make it happen.” It encompasses data analytics but extends into more complex predictive and prescriptive tasks. Data Visualization is the graphical representation of data and information, serving as the crucial bridge to human understanding by transforming complex datasets into intuitive charts, graphs, and dashboards that reveal patterns, trends, and outliers.
How is Agentic AI transforming Data Science and Analytics?
Agentic AI is revolutionizing Data Science and Analytics by moving beyond traditional automation to autonomous decision-making. In Data Science, Agentic AI can generate data, convert business logic into SQL queries, and create ingestion scripts, allowing data scientists to orchestrate intelligent systems rather than performing manual tasks. In Analytics, autonomous analytics systems, powered by Agentic AI, can identify patterns, anomalies, and insights with minimal human intervention, significantly accelerating diagnostic and predictive capabilities and enabling organizations to react with unprecedented speed .
What is Decision Intelligence (DI) and why is it important in 2026?
Decision Intelligence (DI) is an emerging discipline that combines data, AI, and human judgment to improve decision-making at scale. It represents an evolution beyond traditional business intelligence and analytics, offering a more holistic and impactful framework for strategic choices. In 2026, DI is crucial because it provides a structured approach to integrate complex data insights with AI-driven recommendations and human expertise, leading to more effective and repeatable decision-making processes. Organizations adopting DI have reported significant improvements in decision-making effectiveness .
What are the key skills needed to thrive in the evolving data landscape?
Beyond traditional technical literacy in programming languages (like Python or R) and statistical methods, the evolving data landscape demands “AI Orchestration” skills. This includes the ability to design, manage, and interpret AI-driven data workflows, understand Agentic AI, and leverage generative AI for tasks like visualization creation. Proficiency in tools like Power BI for data visualization and business intelligence, coupled with a strong grasp of machine learning principles, is also increasingly vital. Continuous learning and adaptability to new technologies are paramount for professionals to bridge the skills gap and remain competitive .
How can organizations ensure their data visualization efforts are effective?
Effective data visualization goes beyond creating aesthetically pleasing charts; it’s about clear communication and actionable insights. Organizations can ensure effectiveness by focusing on real-time visual analytics, which provides dynamic and interactive visualizations that update continuously, offering immediate feedback on evolving data landscapes . Additionally, leveraging generative AI for visualization can democratize access to powerful tools, allowing users to describe desired insights in natural language. Crucially, visualizations should be designed with the end-user in mind, transforming complex data into narratives that stakeholders can easily understand and act upon.
References
[1] Gartner. (2026, March 11 ). Gartner Announces Top Predictions for Data and Analytics in 2026.
[2] LinkedIn. (2026 ). 5 Major Trends in AI and Data Science for 2026.
[3] TDWI. (2026, January ). 2026 Trends: TDWI’s Top 12 AI, Analytics & Data Predictions.
[4] Polestar Analytics. (2026, February 19 ). Anticipating Top 6 Data Analytics Trends For 2026.
[5] CIO. (2026, February 18 ). More than data, decision intelligence is your competitive advantage.


[…] Beyond the Buzzwords: Mastering the Synergy of Data Science, Analytics, and Visualization in 2026 […]